A deck argues you are good. A dashboard proves it.
A local SEO pitch template is the artifact you hand a prospect that frames a verdict and shows the work, so they can see exactly what they are buying before they pay a dollar. Get it right and it does two jobs a slide deck never can: it closes the deal, and then it keeps the client paying every month.
A few weeks back I wrote about finding local businesses whose SEO is broken and pitching them the fix. That post ends at the booked call. This is what you put in front of them on that call, and what they log into after they sign.
The reason a deck loses and this wins is certainty. People do not buy services, they buy the belief it will work. A deck is a claim. This shows the prospect the exact sequence, ranked by dollars, on their own market, with their own name on the page. That is proof before they pay, and proof is what closes.
One $0.50 file, two jobs
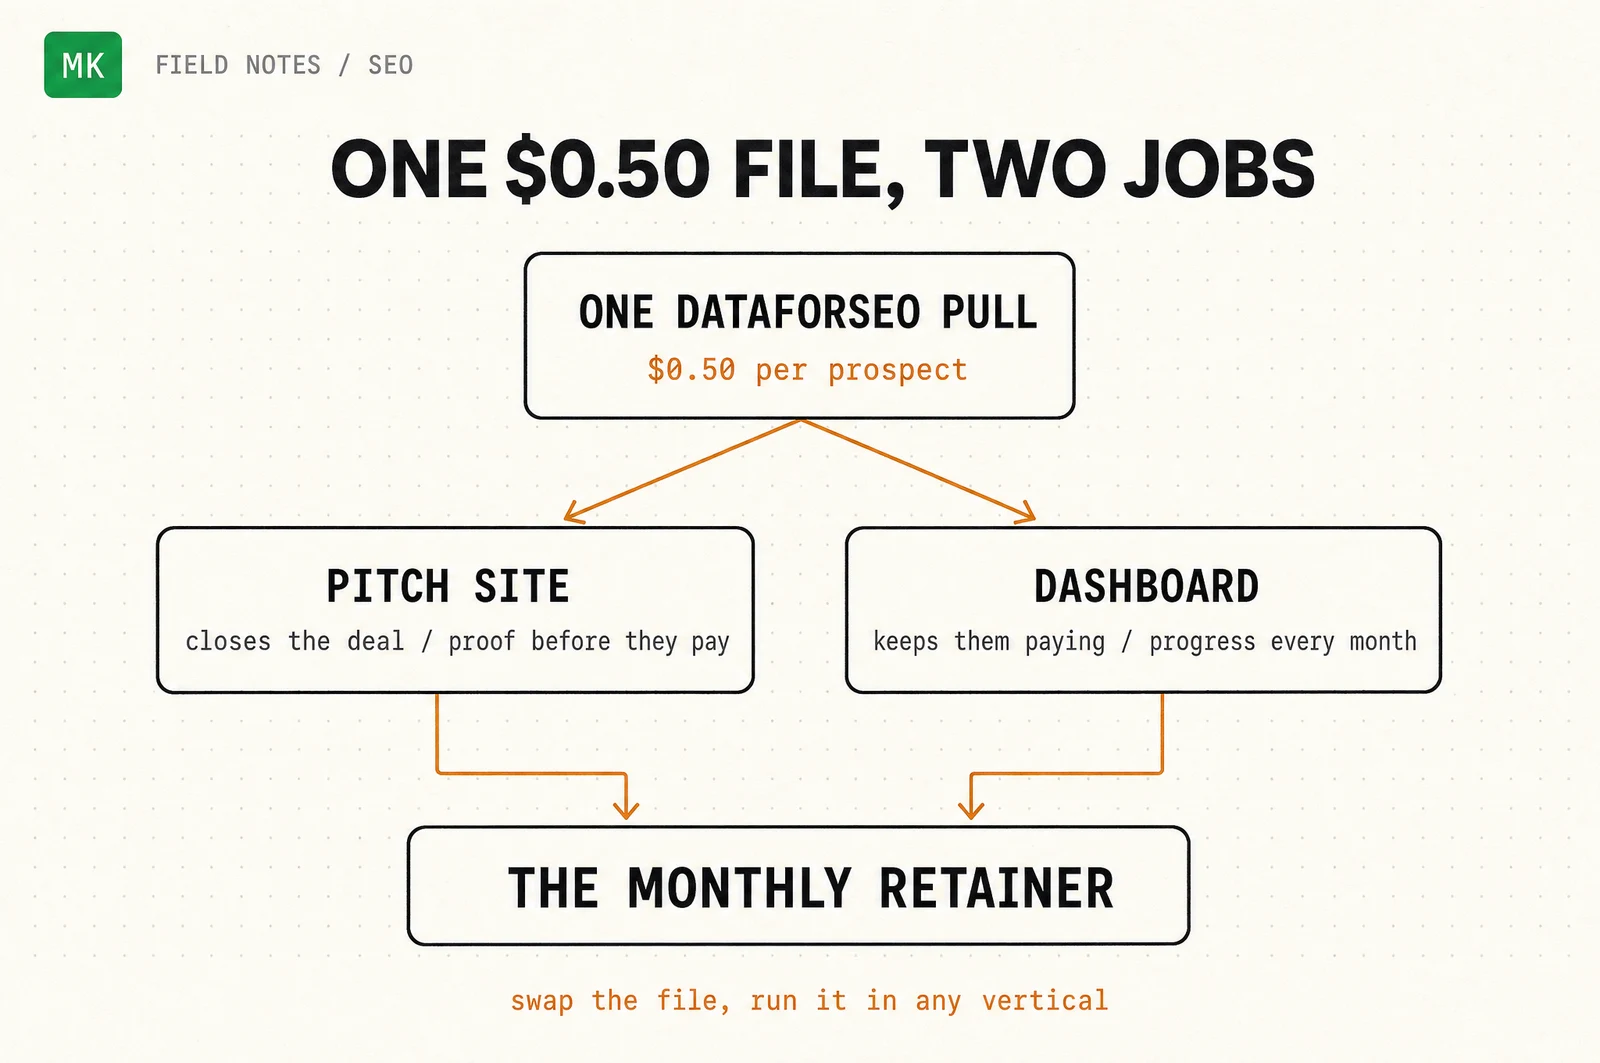
It is one DataForSEO pull per prospect, about fifty cents. That one file feeds two static artifacts that run in a browser with no server and no login. The pitch site closes the deal. The dashboard keeps them paying. Swap the file and both repopulate, so the same engine runs in any vertical in your city.
Job one: the pitch site that closes
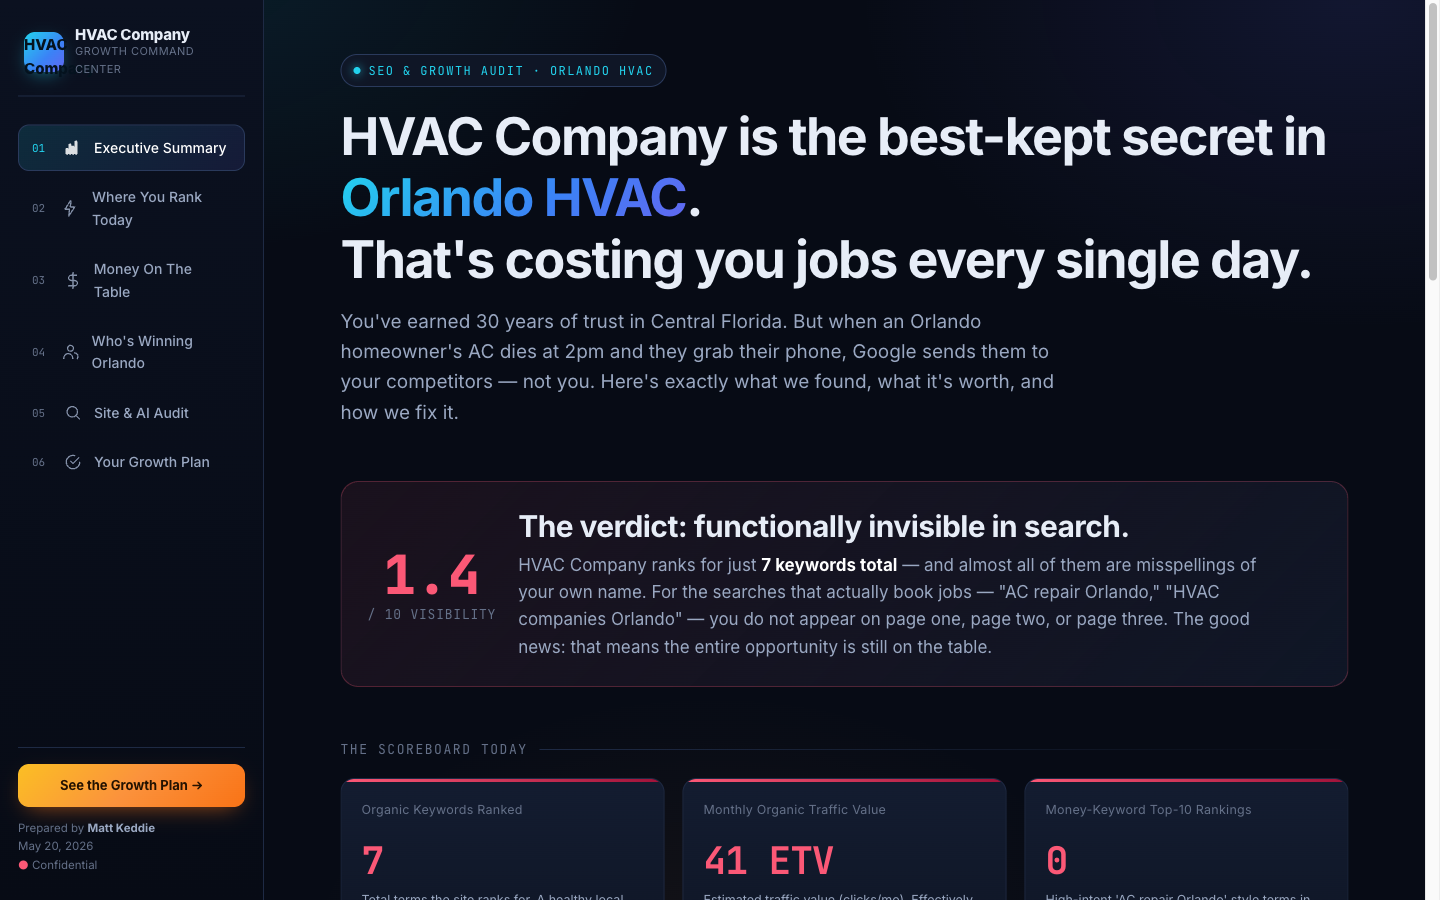
Six pages, verdict to plan. It opens with the verdict. One number, one sentence, one decision.
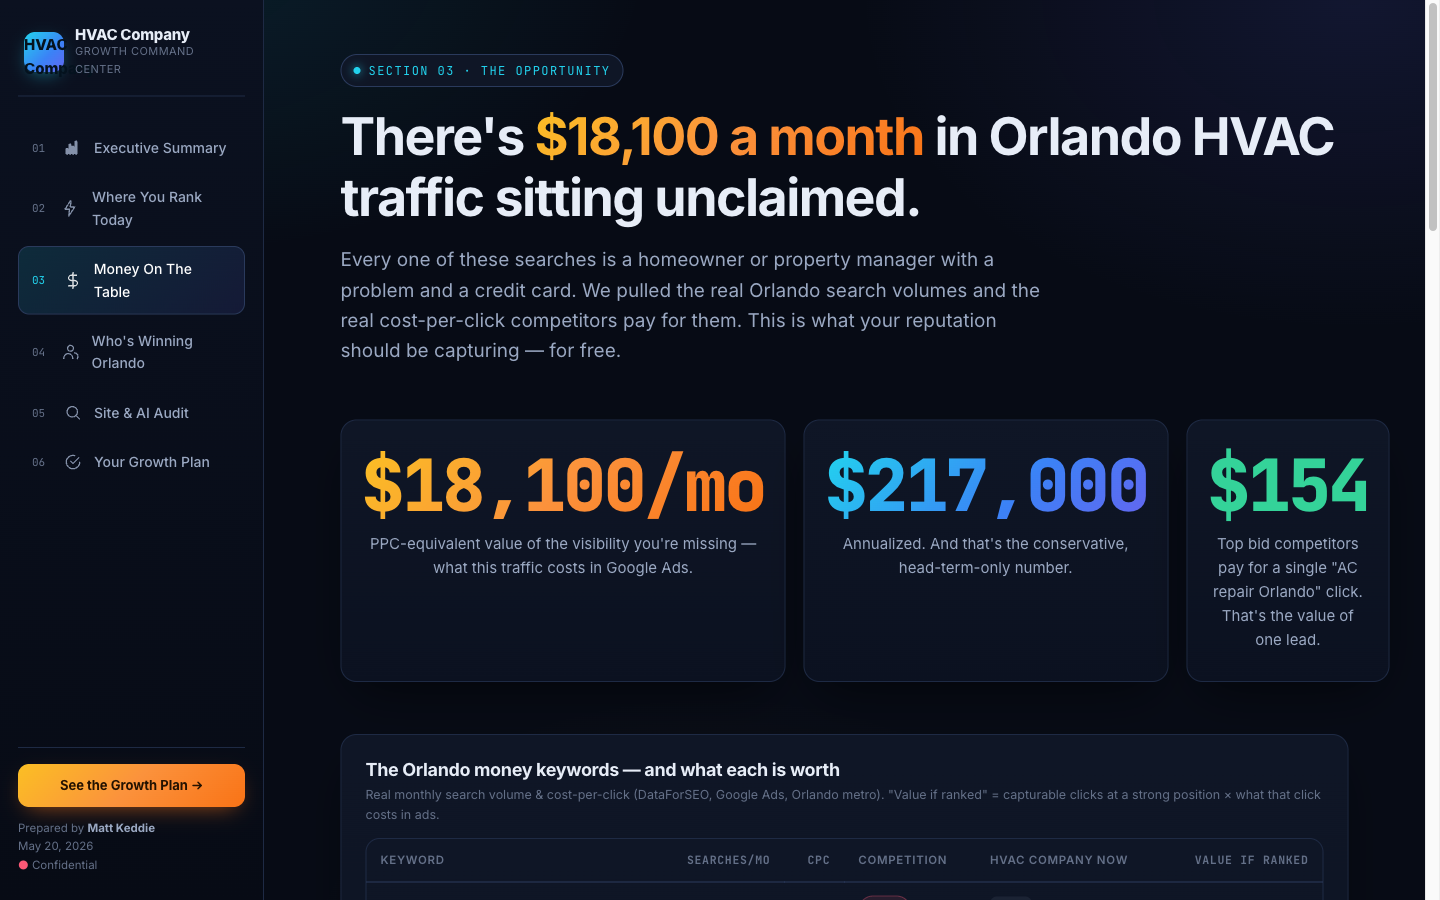
Then the dollars. Real DataForSEO traffic value, plotted as what those clicks would cost in Google Ads if they are not ranking for them. For this Orlando prospect that is $18,100 a month of unclaimed visibility, $217,000 a year, against a top bid of $154 for "AC repair Orlando."
Then the phased plan, and the price.
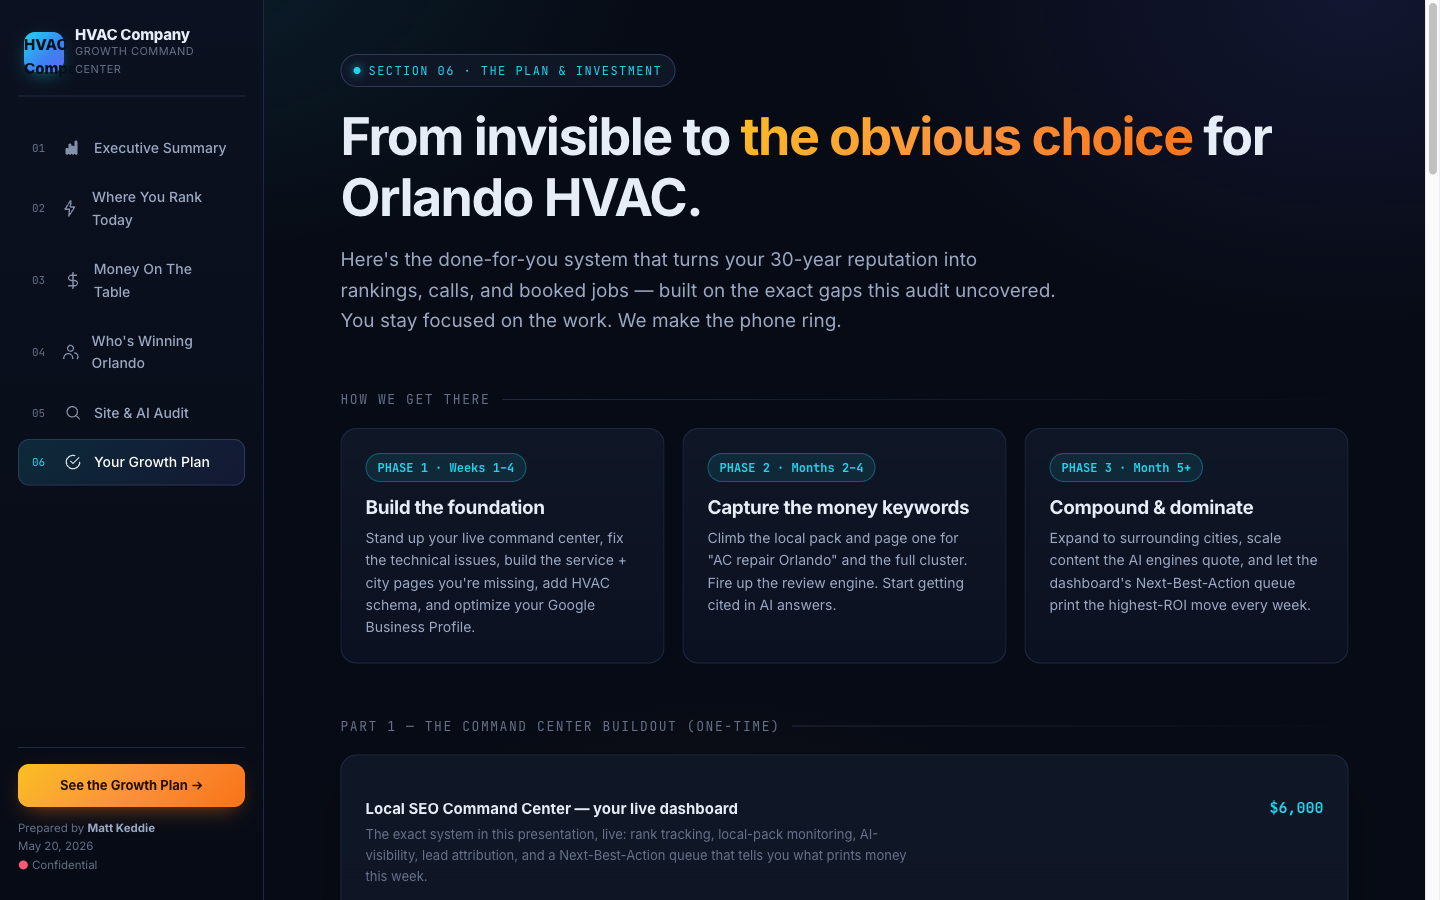
Every number is their market. That is the whole difference between "we are good at SEO" and "here is exactly what you are leaving on the table, and here is the order I will go get it." One is a claim. The other is a decision.
Job two: the dashboard that keeps them paying
Here is the part almost nobody builds, and it is where the recurring money lives. A one-time audit gets you paid once. A dashboard the client logs into is a retainer.
A teardown gets you paid once. A dashboard that shows the phone ringing more, month after month, gets you paid every month.
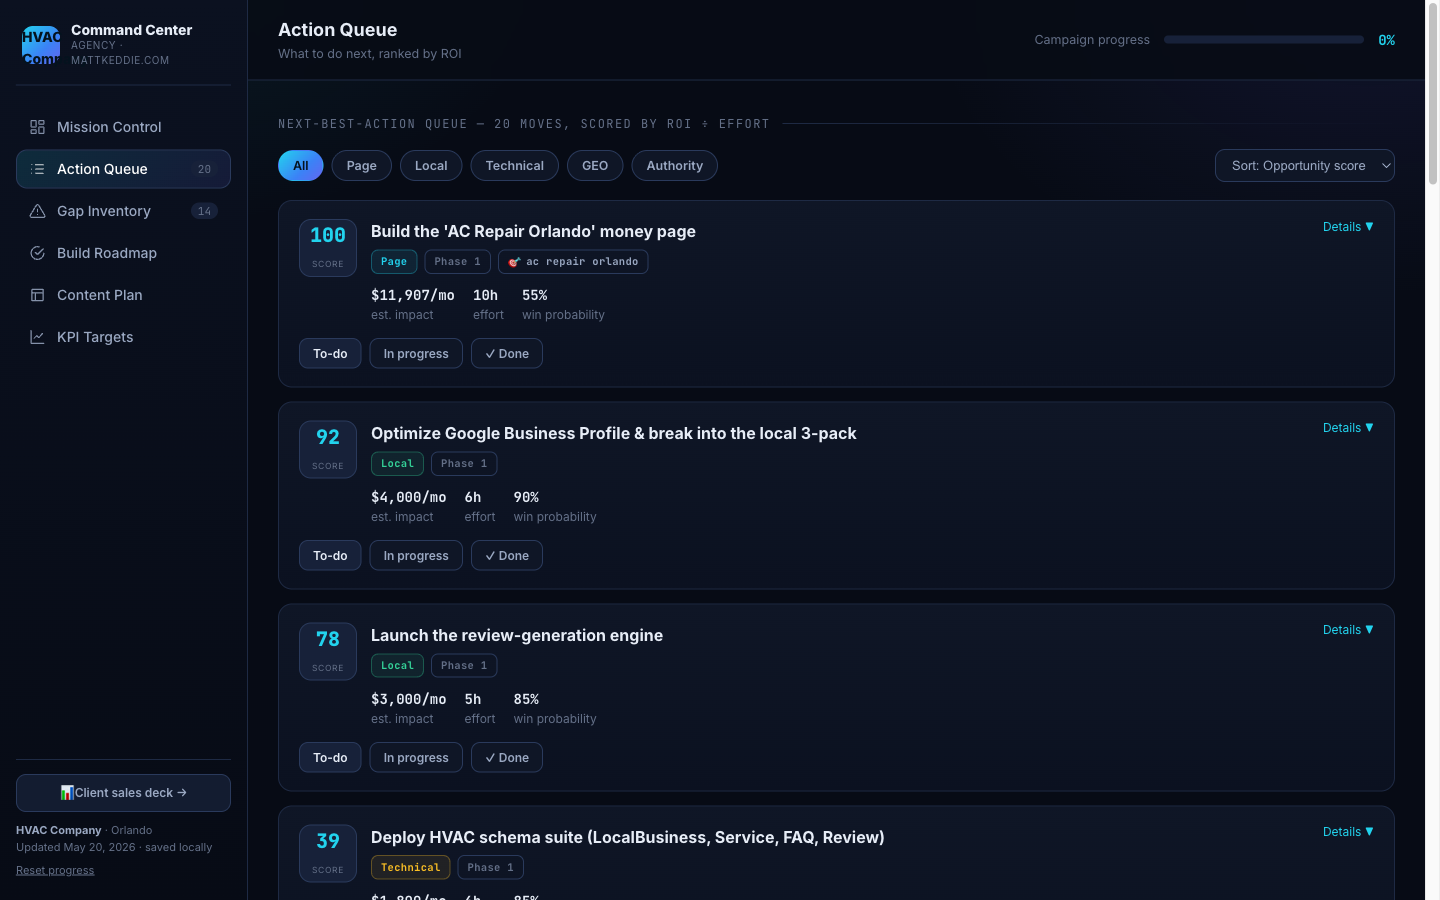
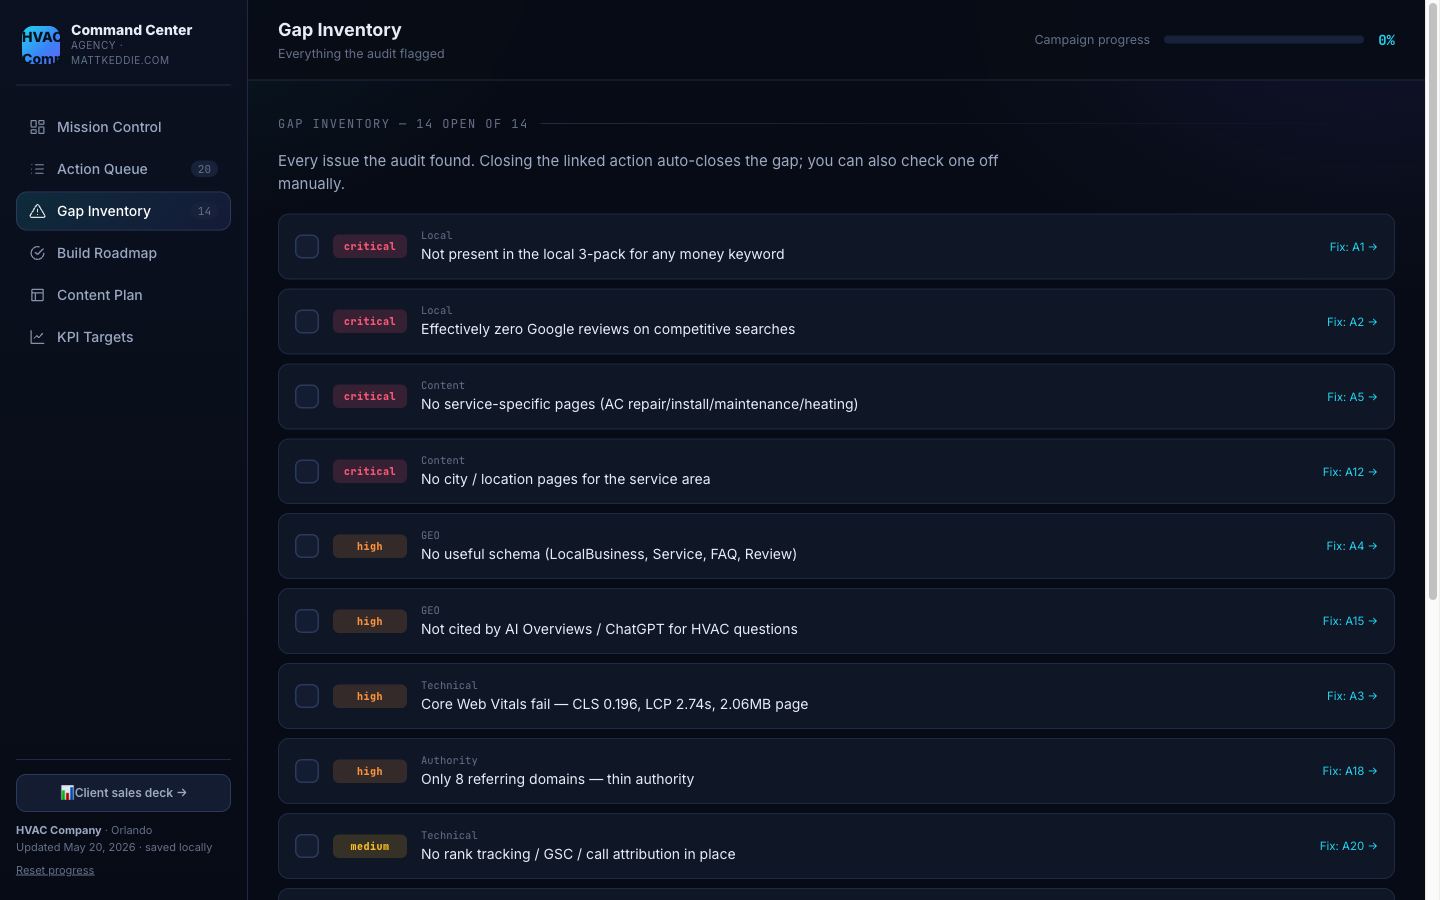
The dashboard is the same data file, a different surface. It ranks every move by dollar return and tracks the KPIs from the audit baseline to the goal. When a client can watch the actions close and the numbers climb, they do not churn. And churn is the whole game: at fifteen percent monthly churn you lose eighty-three percent of your clients in a year. The dashboard is what stops the leak.
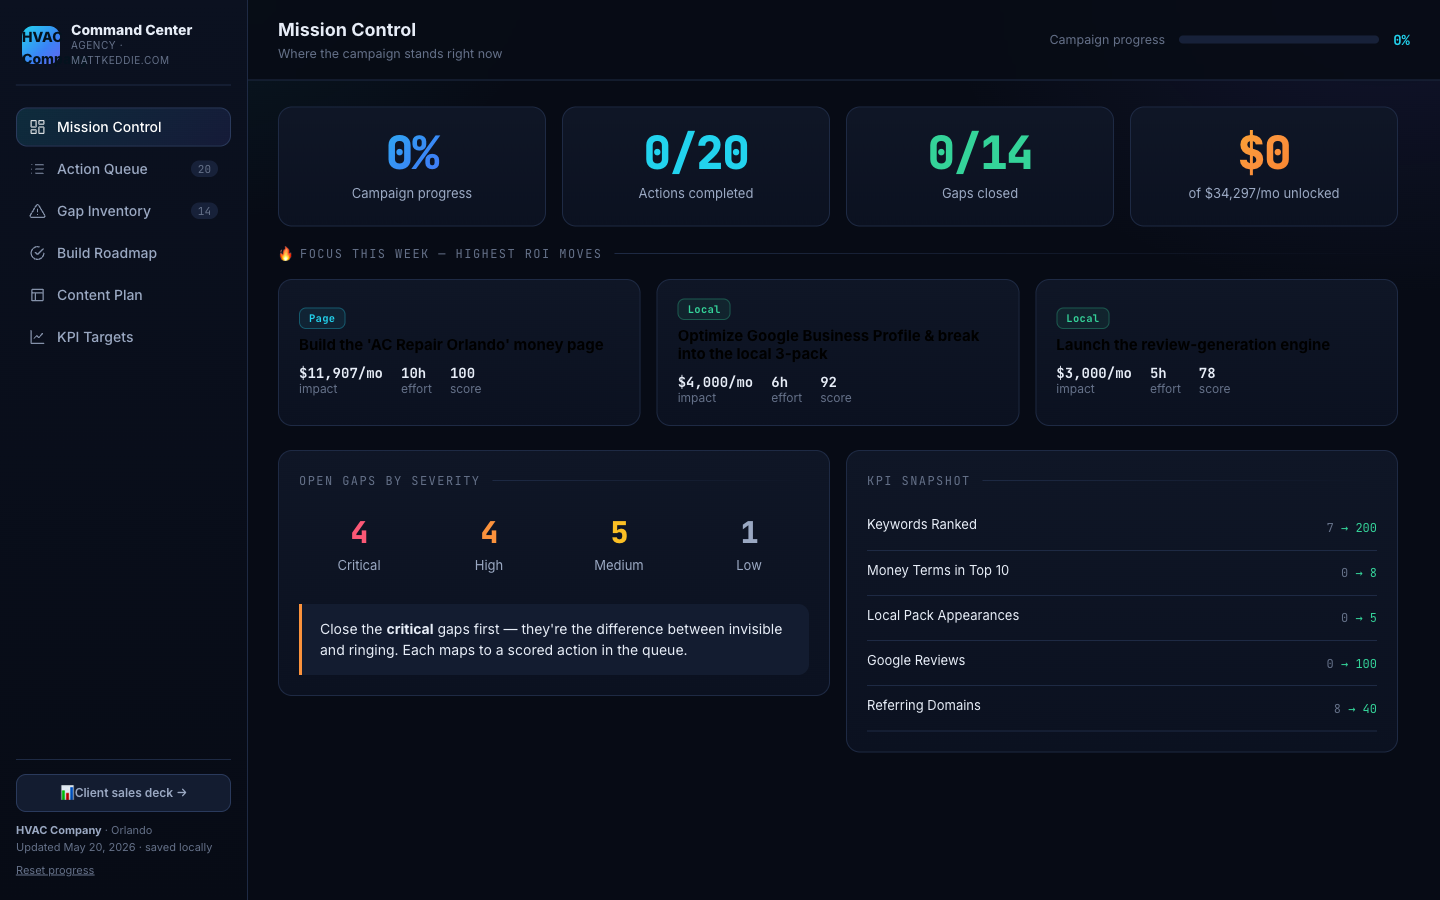
Every action is scored, so you always work the highest-return move first, not the loudest one.
Opportunity Score = (impact_per_month × probability_it_works) / effort_in_hoursThe top action scores 100: about $11,907 a month of impact, 10 hours of effort, a 55 percent win probability. Effort sits in the denominator on purpose. A 2-hour move worth $1,500 beats an 80-hour move worth $3,000, so the list sorts itself and you never spend a week moving a 3 percent needle.
The same local SEO pitch template, cloned across every vertical
The brand name in the templates is a placeholder. Claude reads the prospect's real site, the title tag, the services nav, the contact page, and rewrites it with their real name and city. Swap the data file and the whole UI repopulates.
So the folder that pitched an HVAC company pitches a dentist, a roofer, or a law firm for about fifty cents each. You are not building a pitch. You are running a machine that prints a custom, proof-loaded pitch for any business in any vertical, and you can test three verticals in an afternoon to see which one bites.
Take the whole kit
I showed the last two posts and gave you the tools. Same here. This is the actual pitch site and the actual dashboard, brand-swappable, with a 10-minute quickstart on swapping the brand and dropping in your own data.
Click through the live versions first if you want. Open them on a desktop, 1200px or wider.
The pitch site, six pages, verdict to plan.
The dashboard, the system the prospect logs into.
The brand name "HVAC Company" is a placeholder. The Orlando data is real. The version you send a prospect has their name, their city, their numbers.
What this is really for
If you read the post on finding clients, this is the other half of the same machine. That one gets you the yes. This one turns the yes into a signature, and the signature into a client who pays you every month. Same fifty-cent file. Go run it on one prospect in your city and watch a slide deck turn into a decision.